Events GHG Tools Review

We are seeing more events taking their greenhouse gas emissions management serious, and thankfully, fantastic examples of reductions and removals initiatives are happening in our industry.
What to measure, how to measure, and how do we compare to others, remain the big questions.
We know we can’t manage without measuring, and the past few years have seen a flourish of resources to help events measure their GHGs. With all the new tools being built, we’re also seeing an equal number of interpretations and approaches to measurement, which makes things a bit confusing.
I thought it was time for a round-up of the tools, to check in on where the tools are aligned, and highlight the different approaches that might suit your type of event.
As we move forward, and tools are updated, we hopefully will have all tools using the same rules of thumb, the same assumptions and the same interpretations of the GHG Protocol and GHG accounting standards.
We’re working on that over at the Carbon Accounting Alliance where we’re drawing on all the fantastic thinking that’s been done in various event sectors and locations, into the one place, so we can all work from the same play book.
What’s Included for Measurement?
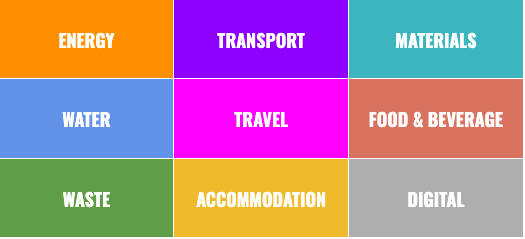
The good news is that many of the tools reviewed touch on the essential GHG measurement inclusions. The big ticket categories we must measure are:
So to the tools…
Most of the tools are online platforms or calculators, and we have a couple few downloadable spreadsheet options. There were some surprising gaps in what some measure, and equally, a surprising amount of detail, and sometimes quite oddly specific detail to the exclusion of other elements.
I'll be publishing a tool-by-tool review soon. I've reviewed more than 40 tools, and I won't list them all, but here are some of the standouts! The paid ones are seriously good. The free ones are pretty darn good too!
Paid: Climeet, Trace, SEMS, EventDecision, MeasureEvent, Green Producers Club
Free: Julie's Bicycle CC Tools, Green Events Tool
I've also so many more tools which are really great for particular features or niches, and I'll be profiling them, along with the tools mentioned above, really soon.
Now to keep you updated, here's what I've found so far. I’ll look at each main GHG category, one at a time.
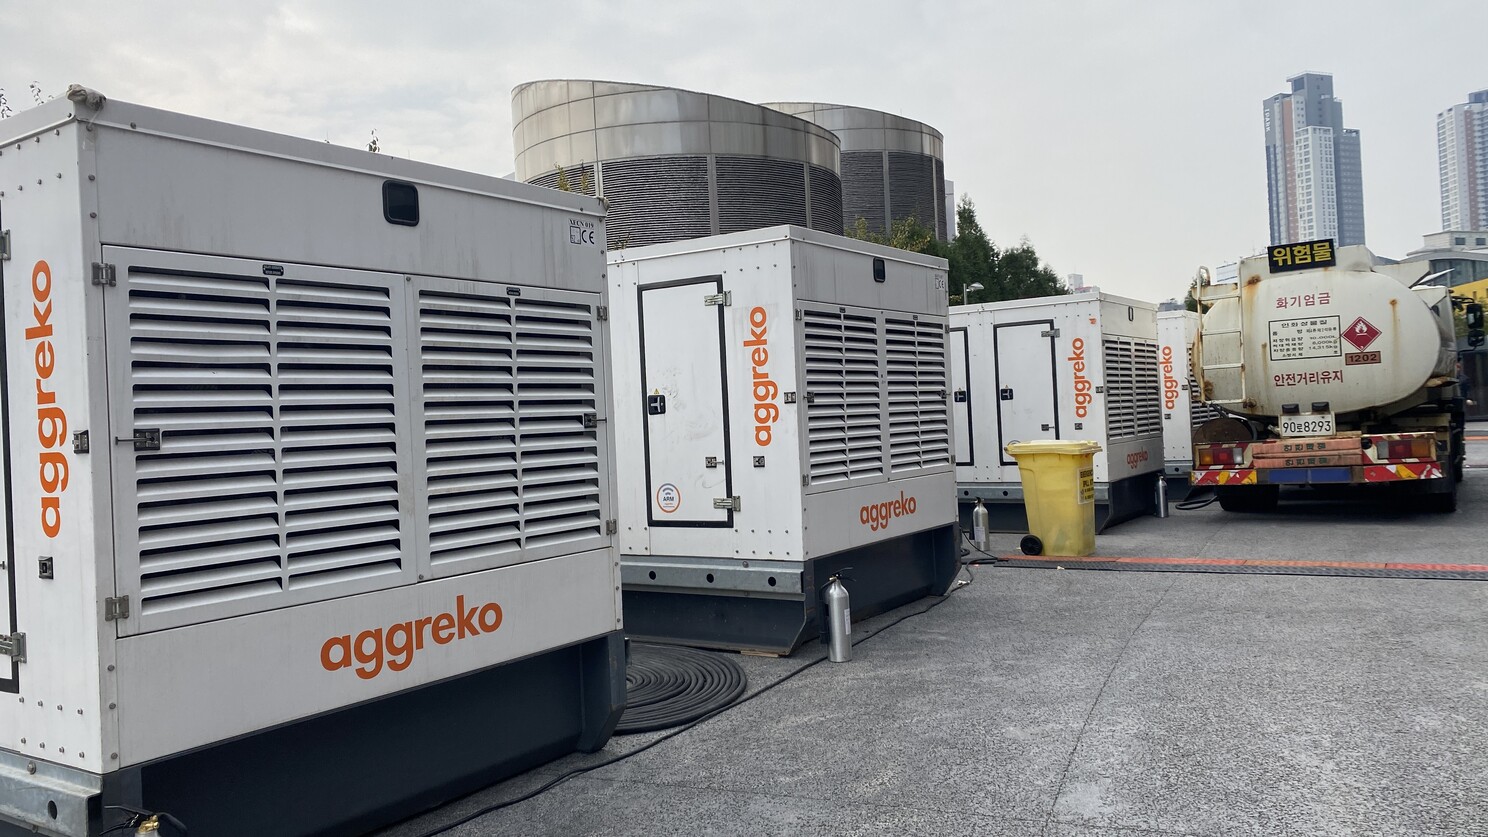
Energy
One of the most obvious and universally included GHG sources is energy.
In events we’re using energy for powering the event (electricity), and for heating and cooking (gas, wood, sometimes heating oil). We use fuel (e.g. diesel, petrol or gas) in both power generators and for vehicles and equipment.
The GHG tools reviewed have different approaches in this category. Some separated out electricity, gas and heating, from transport (which is the best way I think). Some bundled electricity, gas and fuel in vehicles together which I found difficult.
- Not all tools include an option if you're on 100% renewable energy for your electricity.
- Surprisingly some tools exclude temporary power generators altogether.
- Not all tools allow for heating or cooling purchased separately (such as in district heating/cooling).
- Very few tools include refrigerant/fugitive emissions from AC.
- Some tools include the WTT (well to tank) uplift in the emissions factor sources, others do not.
- Only two tools mention hybrid, hydrogen or battery power, and few have the capability to separate out renewable energy created onsite through permanent infrastructure.
- Gas (e.g. LPG) in forklifts or pyrotechnics is not specified in any of the tools, but in some tools you could work around this and include it in cooking or heating gas.
Common metrics:
- kWh electricity
- Litres of (liquid) fuel
- KG of (solid or gaseous) fuel
Divergence
- Bundling fuel for electricity with fuel for vehicles, plant and equipment
- Inclusion or not of WTT
- Some tools use venue metrics to estimate power use, rather than actual measurement
Water
Water used and waste water generated was only included in about half the tools.
Some tools segregated water into potable water (from municipal mains or tanker truck deliveries), non-potable water, and water from onsite (bores, wells, rainwater collection, streams).
Not many tools specifically included wastewater, and some made the estimation that 80% of the water consumed would end up as waste water (presumably through catering, cleaning and toilets!).
Few tools specified sewage, and that’s interesting because we have an increasing number of compost toilets being used at notable music festivals, and other toilet offerings for events trading on their efficiency in both water and energy.
Common metrics:
- Litres or cubic metres of water
- Water by source
- Wastewater generated, by treatment type
Divergence
- Not many tools actually include water or waste water
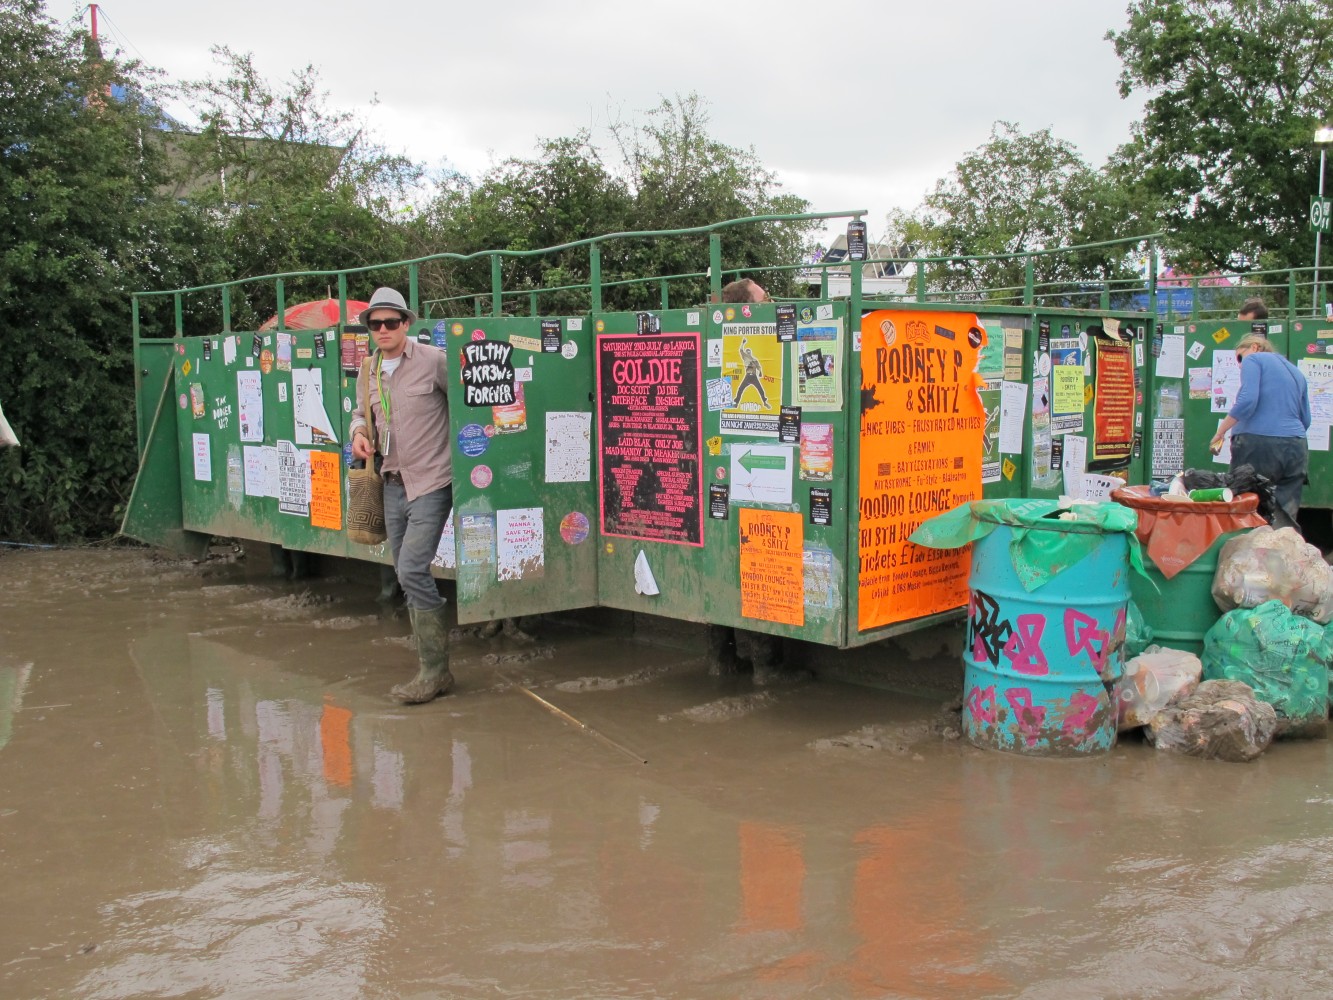
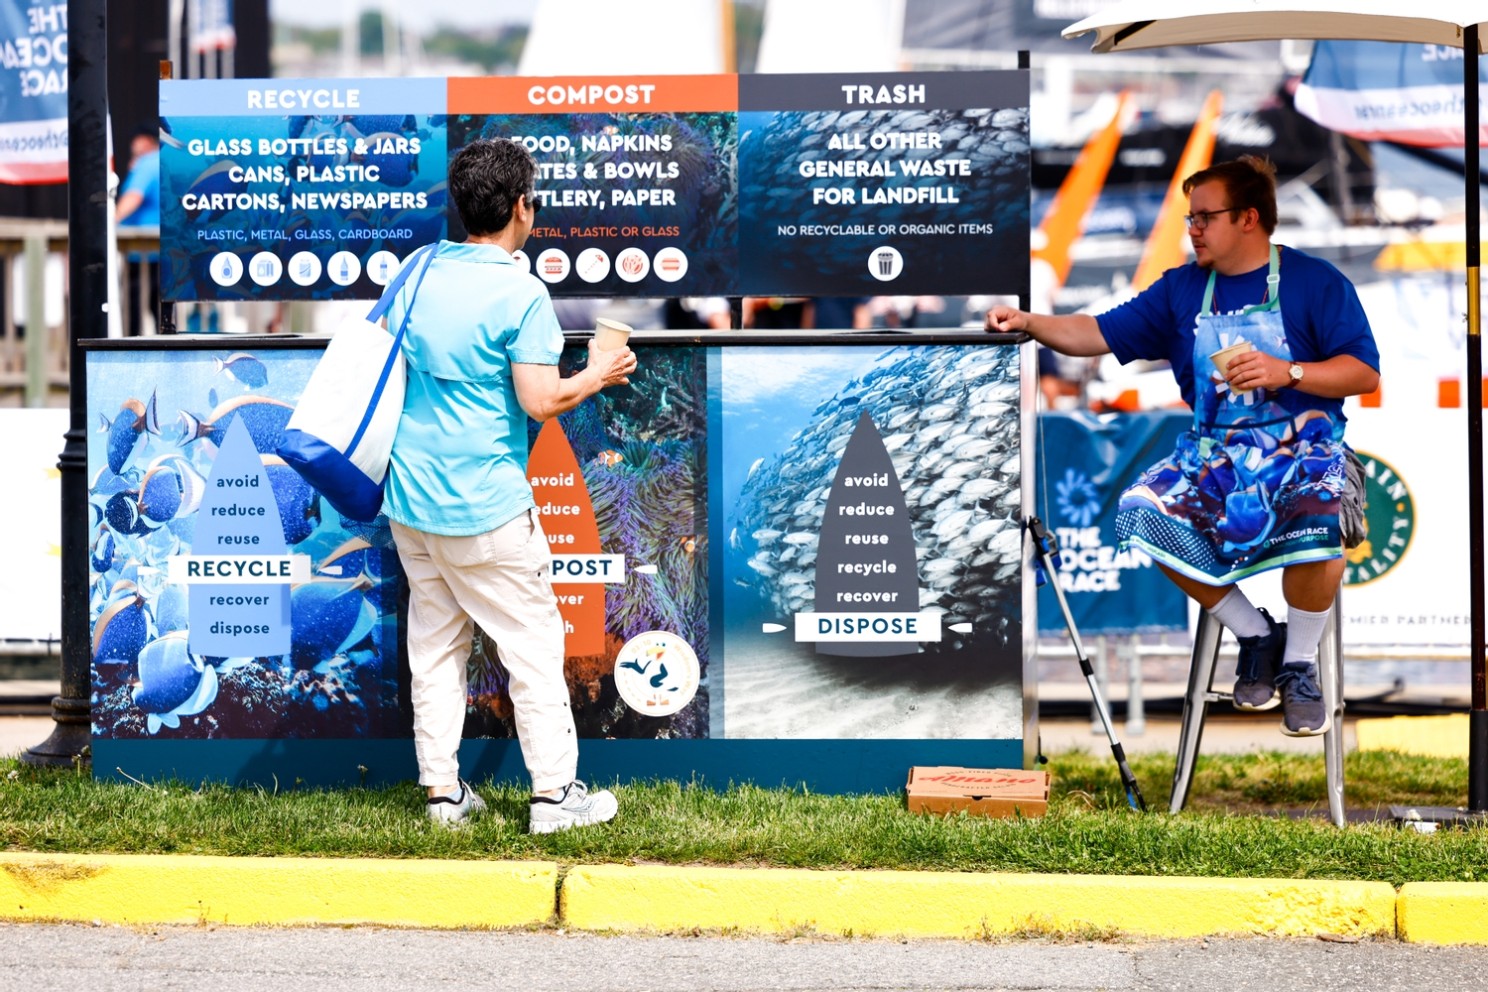 Waste
Waste
Many tools included waste as a GHG source. Of those, most included at least a separation into waste types, such as grouping recycling together, or compostable/food waste. Some went into detail on single stream materials and their corresponding processing.
Some tools didn’t include waste at all.
Other tools took an odd approach and had waste attached to all sorts of various event production operations, such as venue, and then caterers, and then as it applies to materials, and finally waste was treated again separately if it didn't belong in one of the other areas.
One tool has included an interesting aspect and that is the GHGs related to the production of that material prior to it becoming waste. This is a great idea for packaging and other items that haven’t already been included, but taking a wholesale approach would lead to double accounting, especially when it comes to GHGs related to beverage containers, if the F&B GHGs already have factored in GHGs for beverages.
Common metrics
- kg or tonne of residual waste
- kg or tonne of recycled
- kg or tonne of waste by material type, cross referenced with processing type
Divergence
- Those tools that homogenise all waste together will likely have a very different GHG result from those that go into exquisite detail.

Transport
Transport was a category I’d view as absolutely essential to include but the variety of approaches was vast, and some tools had a very light touch on this.
Some tools confused/mingled vehicles used to move people (cars, buses, public transport) with vehicles used to move things (logistics). Some tools didn’t include transport at all. One tool conspicuously omitted air freight. Many tools had no functionality to help users to separate transport in the obvious categories of freighting, transport of infrastructure by contractors, and delivery of goods and supplies.
I was mostly underwhelmed on this category, but there were some standouts. Most of the heavy lifting in transport in data wrangling will need to be done, for almost all tools, prior to being ready to input the data into the tool.
Common metrics:
- Type of vehicle
- Distance transported
- Weight of goods
Divergence
- Very light touch, or no transport at all
- Combining transport impact into overall fuel consumption
Travel
Travel was always going to be a category with a lot of different approaches.
Some tools include all (or most common) modes of travel. Some only include flights, others only ground travel, and some vice versa!
A big divergence, which is fundamental to comparisons, is that some tools include the RFI (radiating force index) multiplier of 1.9 and some do not. This means an almost doubling (or halving depending on your perspective) of GHGs attributable to flights.
There is also no consistency in approach or guidance on which flights to include. Some tools only consider attendee flights, others don’t specify passenger type, and some specify staff or artists only.
Some tools have the facility to upload a CSV/XLSX which includes airport origin and destination code, class or travel. Other tools ask you to type in one by one, the flights by route, and to put the number of flights for each route. Some don’t include travel class. One asked the percentage of SAV.
Other tools don’t ask for flight details at all, and rather, do their estimations based on the number of event attendees per distance category. The same for ground travel, with the tool adding assumptions based on average distances the tool has decided to include.
In another example, flight impacts and associated ground travel, is estimated based on the postcode of the registered event attendee’s home address, and the tool’s backend calculates all the various travel modes including home to airport, airport to hotel/venue.
In a final anomaly, one tool has a built-in assumption that 50% of people would have flown business class. Not in my reality.
Summary of measurement approaches
- Upload a detailed CSV or XLSX
- Enter the number of flights by flight route, directly into the tool
- Categorise your attendees by distance from the venue and allow the tool to calculate
- Provide postcode/address data and allow the tool to calculate
Divergence
- Inclusion or not of RFI for flights
- Embedding assumptions such as mode or class of travel
- Not allowing categorisation of all the participant groups
- Only considering attendee travel
- Only considering staff travel
- Missing travel options altogether
Accommodation
For some events, hotel nights could be a big contributor to the overall GHG inventory. The sophistication level of GHG emissions factors applicable to hotel nights is growing. Most tools are using data which can be traced back to the Cornell Hotel Sustainability Benchmarking (CHSB).
There is no consistency in the tools reviewed on the way that the various tools treat hotel GHGs, apart from the source of emissions factors.
Not all tools include hotel nights in their calculations. Some tools only include hotel nights for attendees. Others only include hotel nights for production staff and not attendees.
Common metrics:
- Number of hotel nights
- Draws on event destination to apply correct emissions factor per night
Divergence
- Not all include hotel nights
- No similarity in who’s hotel nights are included
Materials, Supplies, Purchasing, Hiring
Most tools include materials and supplies but, as with all the categories, there’s a variety of approaches. A couple of the tools use a spend-based approach, or at least for some categories of spending. Mainly the tools choose either to go on a product basis or a (raw-ish) materials basis.
Ultimately they are measuring either the number of items and/or the total kg of materials.
Some tools handily segregate categories of purchasing or organised operationally that seems to make sense for certain event types. There is a degree of detail in them that are sometimes quite random, in that the detail is nice, but there’s no consistency as to why the detail on that item (e.g. rubbish bags) but then miss entirely other categories of products or materials.
Some include, brilliantly, if the material is made from recycled materials (at least 50%). Others ask how the material is going to be dealt with after the event (reused, disposed, repurposed, recycled, back to the hire company). For reused items, some tools ask how many times the item will be used again, presumably apportioning some of its whole-of-life impact to the particular event.
Summary of measurement approaches:
- kg of materials
- number of items
Divergence
- A huge range of approaches to what’s included in terms of materials or products.
- A lot of gaps from one tool to the other
Food & Beverage
A few years ago I did a review on the ways that events have been doing GHG measurement of food and beverage. There was quite the smorgasbord of approaches, but I’m happy to report that we seem to be moving toward a similar recipe now.
Most tools report by meal, and have facility to differentiate between meat, seafood, poultry based, or vegetarian and vegan.
Some tools go into quite the detail on the combo of food offerings events could have, including coffee breaks, buffets, food trucks, meals in bowls, hot or cold snacks and so forth.
Most tools include beverages, but surprisingly some didn’t. One tool’s anomaly had beverages for attendees, but none for crew. Clearly an oversight!
A couple of the tools fantastically included if F&B was served on disposables (by type) or reusables. Loved that.
The emissions factors applied to f&b had as much variety as the menu. Some went back to raw ingredient emissions factors (from various databases) and then built up a typical meal in order to get to the resulting total GHG. Others relied on work already done and published by the IOC which relied on the World Food LCA Database WFLDB 2015.
Some tools had deductions for sustainability credentials of the meals, such as locally sourced, organic, regenerative agriculture or seasonal produce.
Something that I hilariously discovered back in 2021 when I did the original investigation into f&b measurement approaches, was that one GHG accountant added an uplift factor for food at events in the USA because ‘they eat more’...!
Common metrics:
- kg of foodstuff
- kg of food served, based on ingredient combinations and totals
- number of people, then presuming they all eat, number of meals
- number of meals actually prepared or ordered
Divergence
- A huge range of approaches to the types of meals included
- A huge diversity of emissions factors sources and interpretations
Digital, Virtual, Online
We all know our online life has a climate impact, but few are measuring it for events. I was very happy to see some of the tools including it, particularly wrapped up in virtual and hybrid events, but also the impacts of websites, emails, social media and search engines.
As you’ll probably expect, again there are a lot of different approaches and gaps from tool to tool. Some don’t include it at all, and others have done a lot of thinking and a brilliant job.
This is one where we’ll see progression and inclusion as the science becomes sturdier in applying robust methodologies and availability of metrics.
Summary of measurement approaches:
- Hours of virtual event + number of attendees
- Hours of rehearsal + number of participants
- Website traffic, number of emails, search engine enquiries
Divergence
- Not included at all
- A huge diversity of emissions factors sources and interpretations

Stay connected with news and updates!

Sustainable Event Management
Do you need sustainable event management help? Check out our online self-paced courses and downloadable resources.
